Tracing the History of Every Shop in Stoke Newington Church Street
Over the years, I’d occasionally be contacted by new business owners in the street who wanted to know the history of the shop they moved into. I myself was often curious about what certain shops used to be, so I decided to trace and document the history of every shop, which I knew would be an extremely useful resource once completed.
The Process
I began by manually copying the content of 24 street directories into a spreadsheet. The snapshots jump by 5 years, starting from 1847. There was no need to capture every year, nor were street directories available for every year. I keep updating the data as shops close and reopen. The result provides a fascinating insight into how the street has changed since 1847, as many occupations and shops came and went over the years.

The survey goes hand in hand with an annual photo-survey of Stoke Newington Church Street, which I started in 2015, during which I photograph the shopfronts of all the active businesses. You can see the result from each year here.

In early 2024, I was contacted by Historic England, who asked to use the data I compiled in research tools they offer. As far as I’ve been told, this is the only instance of a street in the country that has been documented to such an extent, with the history of every shop dating back such a period.
The Survey
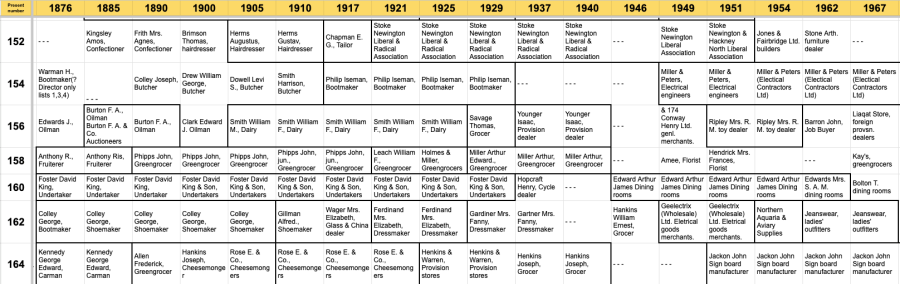
The data is organised in a large spreadsheet that contains a columns for the years, creating a horizontal timeline, and 278 rows for the addresses. Apart from showing the changes to each address, the research also includes mapping of old street numbers and present day ones (the street was renumbered in 1880 and then again in 1937).
There’s a simplified version of the survey that only shows the changes to each shop, rather than the changes by year, which results in a considerable duplication in certain cases, and a somewhat overwhelming amount of data.
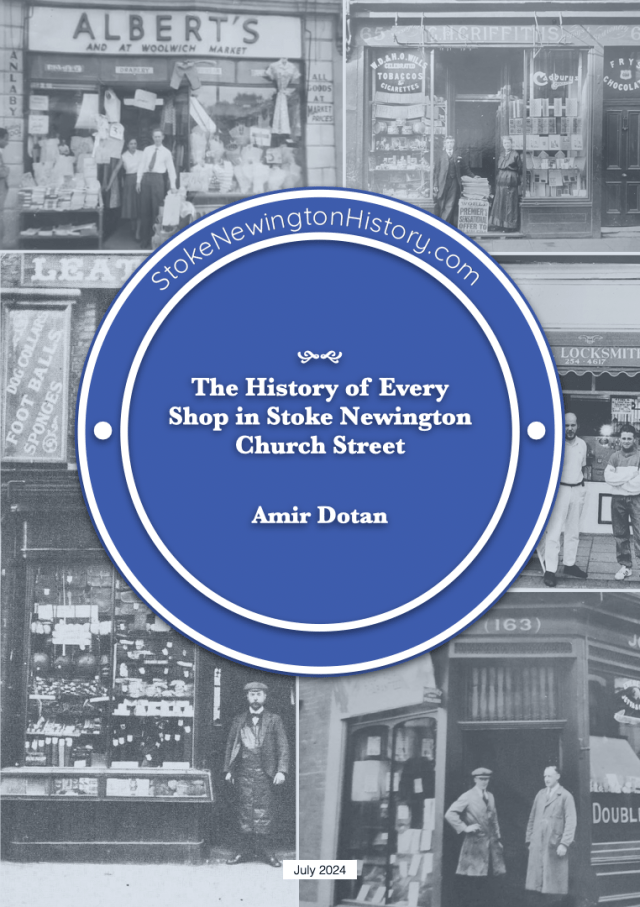
Book: ‘The History of Every Shop in Stoke Newington Church Street’
If you are not a fan of spreadsheets, you’ll be pleased to know I created a print edition with the history of each shop. Apart from the evolution of every shop in the street, it includes a few photos of different shops over the years and a few charts that illustrate various trends. You can view and download the PDF file here.
Analysis
Once all the data was entered into the spreadsheet, it presented fascinating analysis opportunities to explore trends, patterns and statistics about the street’s commercial landscape, such as the rate of change over time, the change in occupancy rate over time and the average number of times a shop in the street changes.
Summary of Analysis
- Total businesses on the street since the 1840s: 1,844.
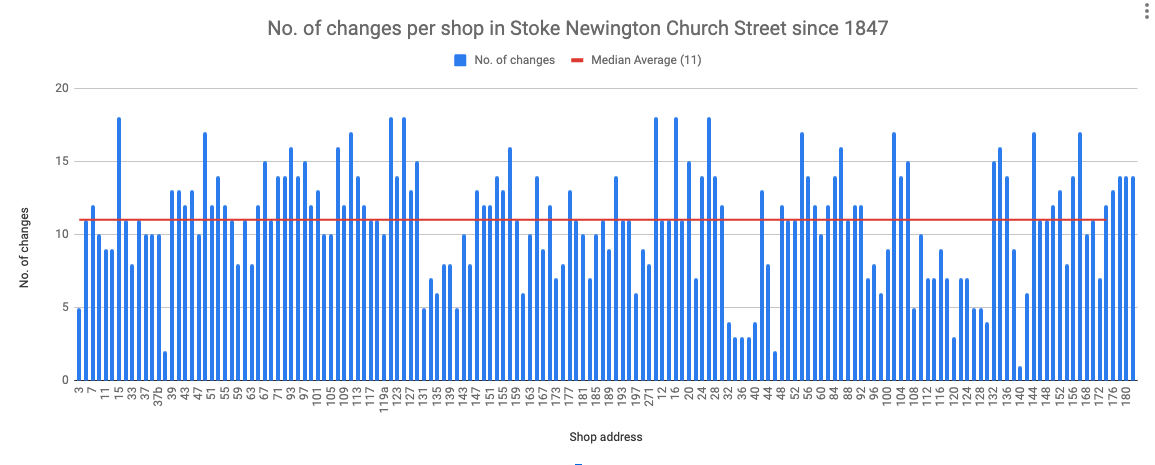
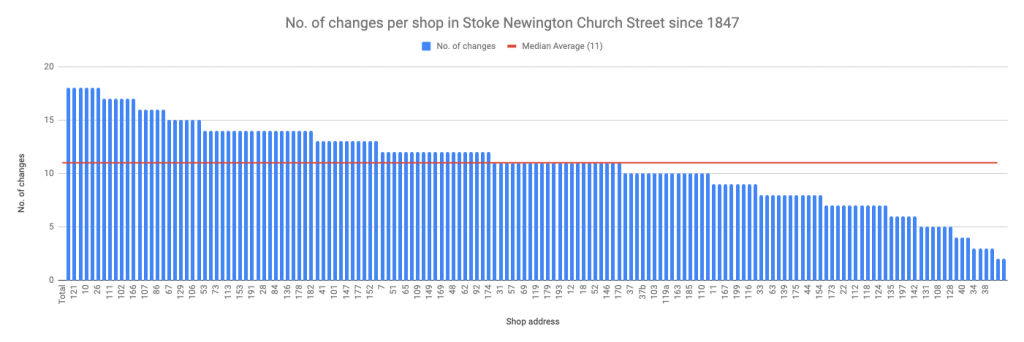
- Average number of shop changes: 11.
- Average trading duration: 9 years.
- Longest continuously trading business today: No. 9 Gino’s Barbershop (opened 1965)
- Longest continuously trading business ever: Nos. 32-40 Whincop & Son, Timber merchants (1876-1998)
- Average rate of change over 8.5 years on average is 53%.
- Highest rate of change: 75% in the 1980s
- Lowest rate of change: 45% in the 1910s
- Average occupancy rate: 90% (95% in 2024 at the moment)
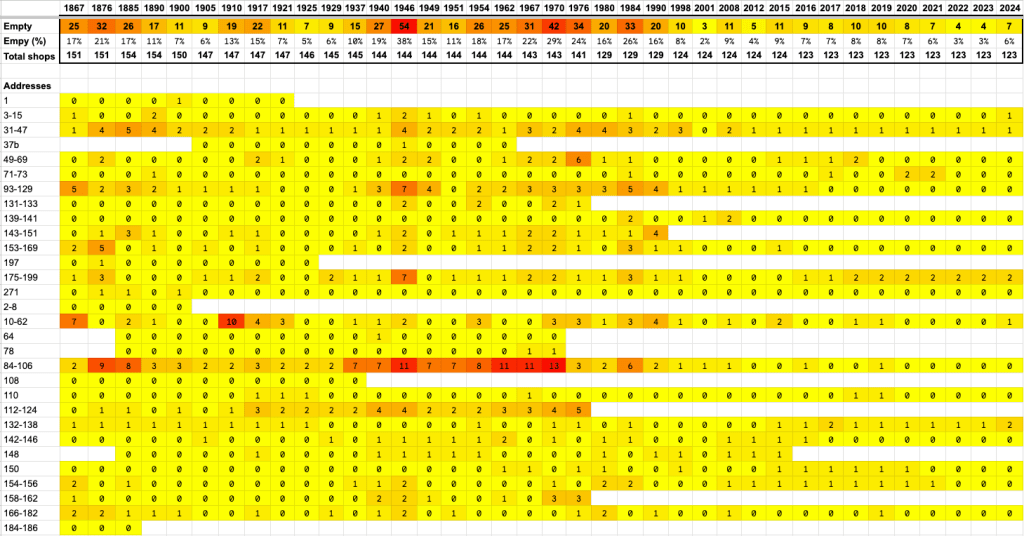
- Lowest occupancy rate: 63% in 1946
- Highest occupancy rate: 98% in 2001
Most Common Business Types Over the Years
I’ve used an online charting tool to create a ‘Race Chart’ using the survey to show the top 20 most common business types over the years. The result is an insightful animation that shows the rise and fall of various industries and businesses since the 1840s. The above is a video recording of the chart, but you can also access the interactive version where you can ‘pause’ and ‘play’ it and move the timeline manually to explore the changes at your own pace.
The Heatmap below is the underlying data behind the ‘Race Chart’ and it shows the number of certain business types and professions in Stoke Newington Church Street over the years.
Trends Through the Decades
The above data lends itself nicely to charting in order to visualise the prevalence of business types in Church Street through the decades, and to show trends such as rise and decline. In some cases, such as with manufacturing and estate agents, they basically swap places in the post-industrial age as the area became more desirable and there was a national increase in homeownership. Here are a few examples:
Manufacturing vs. Estate Agents

Confectioners and Tobacconists

Grocers

Rate of Change
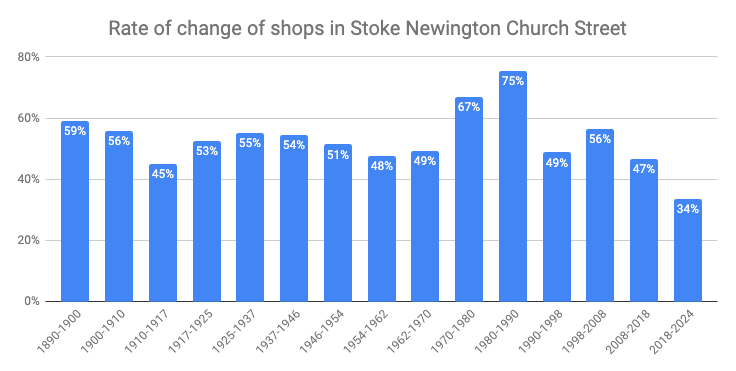
The data collected presented various opportunities for analysis. One of these was the rate of change of shops on the street over time. The average rate of change since the 1890s, observed over an average of 8.5 years, is 53%. This discovery was rather surprising, as I feel there is a prevalent notion that unlike today, churn wasn’t as significant and shops didn’t change as often as they do now. However, there were periods, notably the 1970s and 1980s, when the rate of change was significantly higher than it has been in recent decades.
Number of Changes Per Shop Sorted by Address
Number of Changes Per Shop Sorted by Value
Occupancy Rate
This analysis relies on whether a shop is listed in the street directory. If a shop isn’t listed, it’s likely because it was vacant, though it’s possible it wasn’t included in the directory for various reasons. This hasn’t been an issue since 2015, when I began documenting the street’s shops myself. The postwar spike in empty properties is not surprising.
Occupied Shops

Empty Shops

A quarter of the shops were empty in both 1970 and 1984. This figure declined significantly from the 1990s onwards as the area became more popular and fashionable. There has been a further decline in empty shops since 2018. Three properties (138, 175, 179) have been empty since 2015-2017.
The analysis doesn’t include 2024 as the figure of 7% captures only the year up to April. A handful of shops close every year around this time, with most reopening within the following 6 months or so. The figure may increase, decrease, or remain the same by the end of the year.
The heat-map below shows the data behind the charts. It displays the number of empty shops (or those that weren’t listed in an old street directory for some reason) for a specific snapshot, as well as the duration shops remained, as some were demolished over the years or converted to residential property as was the case with no. 1 and no. 108.
The chart below shows the empty shops in relation to the total shops on the street at the time. The number of shops in Stoke Newington Church St was reduced over the years, mainly as a result of shops being demolished (to extend the Three Crowns pub, to make way for a fire station in the mid-1970s, conversion to residential property, to extend St. Mary’s Primary School, and for housing redevelopment).

Presentation About the Survey
A presentation about the survey and its results I gave a few times over the years.
In the Media